Or how Abenomics played out.
When Shinzo Abe launched Abenomics, or “extra dimentional” monetary expansion in 2012, expectations were high that Paul Krugman’s inflationary target would put to a real test. Now, after 12 years, we are witnessing results. The chart below shows the extraordinary growth of bank deposit from 2012 to 2023, an increase of almost threefold.
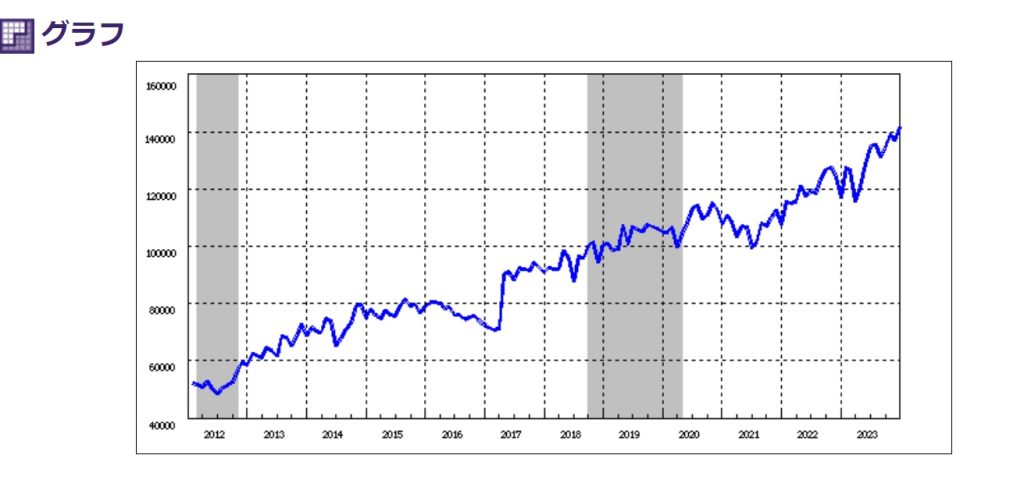
Under the textbook economics scenario, this much expansion of money supply, mostly through BOJ purchases of government debt financing bonds, would lead to a high rate of inflation of goods and services. As everyone knows, however, it did not happen reflecting the “deflation mindset” or a hotixontal LM curve (liquidity trap).
Instead, the prices of real property and stocks have been gardually rising during the past few years, as the assetholders have adjusted their portfolio. Needless to say, this shift resulted in the higher money circulation.
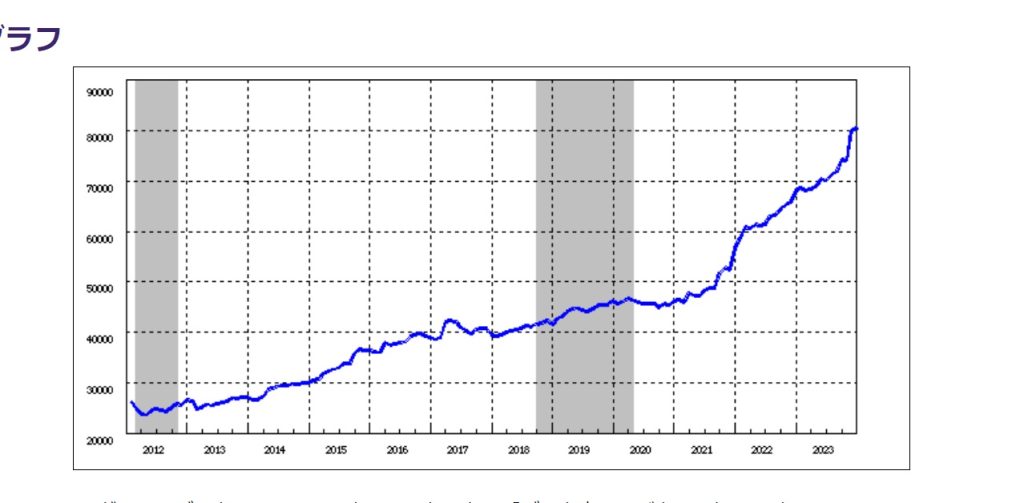
Indeed, the graph above shows a noticeable surge in bank lending starting from 2021, implying a higher money circulation velocity. The higher velocity supports not only the property value expansion but a higher level of prices consumers and industries pay, i.e., “inflation”. See below.
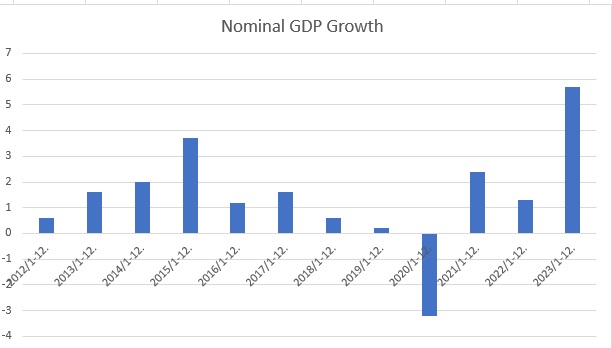
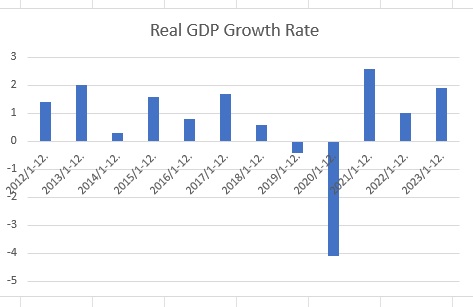
The level of GDP inflation was not evident until 2022, but the 2023 figure clearly indicates a sigifnicant level of inflation. Adding the higher montery velocity, the level of inflationary expection appears to have bottomed out last year.
Then, what would come next, and how this would impact the Japanese society?